Step 1.
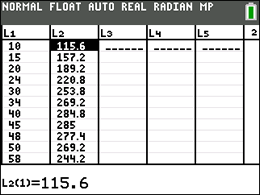
Enter the data into the lists.
For basic entry of data, see Basic
Commands. |
 |
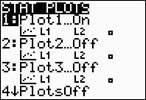
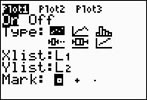
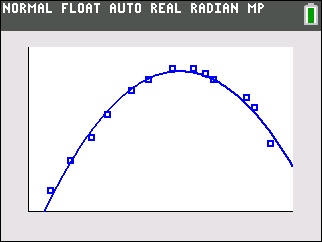
Step 2.
Create a scatter plot of the data.
Go to STATPLOT (2nd Y=)
and choose the first plot. Turn the plot
ON, set the icon to Scatter
Plot (the first one), set Xlist
to L1 and Ylist to
L2 (assuming that is where
you stored the data), and select a Mark of your choice. ZoomStat.
  |
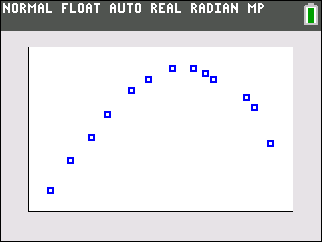
(answer to part a)
|
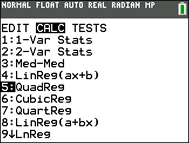
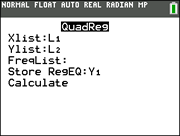
Step 3.
Choose the Quadratic Regression Model.
Press STAT, arrow right to
CALC, and arrow down to
5: QuadReg. Hit
ENTER. When the template for
QuadReg appears on the home
screen, type the parameters L1,
L2, Y1. The Y1
will put the equation into Y=
for you. (Y1 comes from VARS → YVARS, #Function, Y1 or from ALPHA F4)
  |
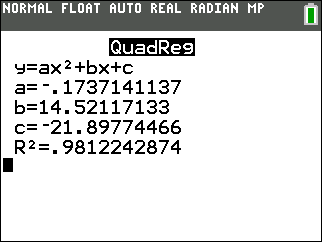
The quadratic regression equation is
y = -0.173x2 + 14.521x - 21.898
(answer to part b)
|
Step 4.
Graph the Quadratic Regression Equation from
Y1.
|
(answer to part b)
|
Step 5.
Is this model a "good fit"?
The coefficient of determination, R
2, is .9812242874 which means
that 98% of the total variation in y can be
explained by the relationship between x and y.
Yes, it is a very "good fit".
(answer to part c) |

|
Step 6.
Extrapolate:
(beyond the data set)
Get the answer from the graph of the regression equation. Check the WINDOW to be sure that 5º falls within the domain (it does).)
Hit TRACE. Arrow up so the regression equation will show at the top of the screen. Type 5 and hit ENTER.
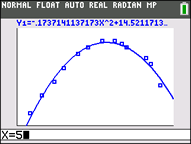 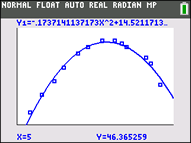
(answer to part d -- At 5°, the distance will be 46.365 feet.) |
Step 7. Interpolate: (within the data set)
From TABLE, find the value in L2 closest to 270. Adjust the TBLSET to narrow in on the answer.
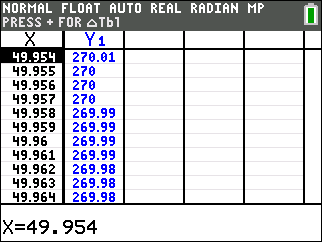
(answer to part e -- angle will be 50° or 34º) |
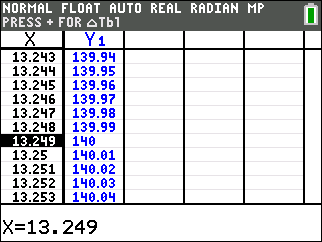
| Step 8. The first baseman is positioned 100 feet from home plate and the right fielder is positioned 180 feet from home plate. The batter wants to hit the ball half way between these players. What angle, to the nearest degree, should be used to accomplish this hit? |
Half way between 100 feet away and 180 feet away is 140 feet. Find the angle within the scatter plot domain that corresponds with 140 feet. 13 degrees (answer to part f).
|
| Step 9. The left field fence is 280 feet from home plate. At what angle, or angles, will the ball be hit past the left field fence? |
Use the TABLE to find values greater than 280. Since the graph is parabolic, you are looking for two locations.
(answer to part g) any angle between 39° and 44°. |