This page will point out how to enter and adjust graphs of square root functions and cube root functions on the TI-Nspire graphing calculator.
Example:Graph a square root function.
Steps: To start, from choose Sketchpad B: Graphs OR Documents 1. New From "Documents:
• If you see "Save?", usual response is "no".
•
• Choose option2. Add Graphs
•
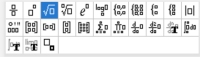
• Get the square root symbol:
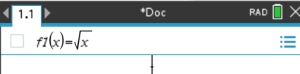
f1(x) =
•
• Type "x". The function will look like
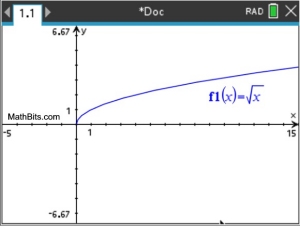
• to see the graph.
You may need to adjust the WINDOW for a better view of the graph. To adjust the "window",
from the "graph" screen,
Hit MENU #4 WINDOW / Zoom
#1 WINDOW Settings
On the graph shown above, the window has been adjusted for x = -5 to x = 15.
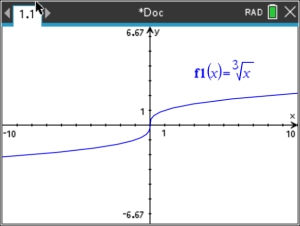
Example:Graph a cube root function.
Graphing a cube root function will follow the same steps as stated for the square root function.